Ask What ChatGPT Can do for Math


Ask not what your country can do for you—
ask what you can do for your country.
John F. Kennedy, Inaugural Address, 1961
Large language models have changed the way many people write. For mathematicians, this transformation raises an obvious and intriguing question: can a tool that predicts text really support mathematical work, where precision and structure are paramount?
As I experimented with ChatGPT, I discovered that it can— so long as I use it as a collaborator, not as an oracle. In this article, the first of two parts, I illustrate how ChatGPT assists me in drawing diagrams, a crucial task in lattice theory.
Some of the code ChatGPT generates is lengthy; the complete files are available online:
https://www.icloud.com/iclouddrive/0f6TeZT0WjrQvmUKN0X3HAatQ#Data_files
Throughout, I remind myself: ChatGPT is an assistant. It performs best when I correct and shape its contributions.
1. DRAWING DIAGRAMS
Lattice theory is visual. Most of my proofs begin with sketches of diagrams, and for decades I drew these by hand. I do not use TikZ to draw diagrams. It is very powerful, but it offers essentially no helpful error messages; it is very easy to make a small mistake and very hard to find it. ChatGPT, by contrast, generates accurate TikZ code even from a short description.
A first example. Consider the lattice N6, with covering relations
\omega < \beta < \tau,\qquad\omega < \gamma < \tau,\qquad\tau < \upsilon,
where \alpha is both an atom and a coatom. A brief prompt produces a workable drawing; see Figure 1.
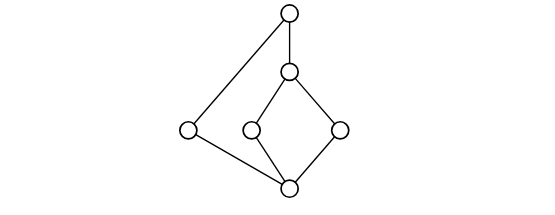
Figure 1. A basic diagram of the lattice N6.
For publication, I want a more polished version. Instead of editing by hand, I ask ChatGPT for a stylized version. The result is Figure 2.
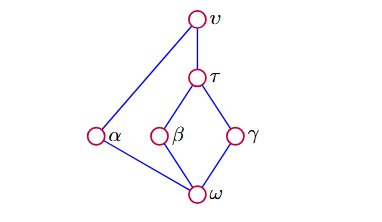
Figure 2. A stylized diagram of N6.
A larger example: a lattice of sublattices. The lattice of all sublattices of N6 is large and intricate. Drawing it manually is hardly feasible; drawing it in TikZ is hopeless. ChatGPT, on the other hand, generates a six-page TikZ file that compiles into a clean sideways diagram.
There is also a practical limit: if a diagram has too many edges, it becomes very hard to read. For the lattice of sublattices of N6 we are close to this limit, but the result is still usable and informative.
Here is the prompt I give ChatGPT:
Draw the diagram of the lattice of sublattices of the lattice N6, circles purple, edges blue behind, print sideways.
Figure 3 shows this diagram.
This is where ChatGPT’s value becomes clearest. It takes only seconds to generate such a complex diagram, so I can experiment freely, try different layouts, or emphasize different structural features—something I never attempted before.
Legend. For reference, here are the 36 sublattices of N6, indexed by a, b, c, \ldots, J:
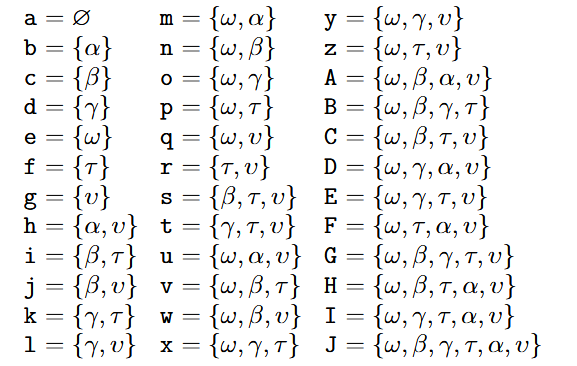
Let me warn you again: Trust but verify. You must check that the Legend and Figure 3 are correct by hand. Tedious but necessary.
What does this mean in practice? ChatGPT can produce a diagram and a legend that look entirely convincing. The circles are neatly spaced, the edges are straight, and every node carries a clean label. It is very tempting to accept such output as authoritative, especially, when the underlying structure—here, the lattice of all sublattices of N6—is too large to visualize comfortably on one’s own. But ChatGPT has no built-in understanding of lattices or sublattices; it is arranging points and lines according to patterns it has learned from text. A single misplaced edge or a missing inclusion can turn a correct diagram into a subtly incorrect one.
So before you trust the picture, you have to do the work that only a mathematician can do. Start from the definition of each sublattice in the legend, confirm that it is closed under the lattice operations, and then check that the corresponding point in Figure 3 is placed at the correct level. Verify, for each cover relation in the diagram, that it really represents a cover in the lattice of sublattices, and that no intermediate sublattice has been omitted. Count the elements: there should be exactly 36 sublattices, each appearing once in both the legend and the diagram. If any of these checks fail, the figure must be corrected.
This may feel old-fashioned in a world where the diagram appears with a single prompt, but the responsibility has not changed. ChatGPT accelerates the production of diagrams; it does not certify their correctness. When it comes to mathematical content, the final authority is still the reader who goes through the definitions, verifications, and cross-checks by hand. Only after this scrutiny has been applied is the diagram ready to be trusted in print.
2. WHAT I LEARNED FROM THESE EXPERIMENTS.
Three observations now guide my use of ChatGPT for diagramming:
(1) It excels at structural understanding. Even a brief description produces TikZ code capturing the correct order-theoretic relationships.
(2) It still needs my judgment. I adjust spacing, colors, annotations, and I check the result for accuracy. ChatGPT provides the scaffolding; I refine it.
(3) The productivity gains are substantial. Tasks that once consumed hours now take minutes. This changes the way I explore examples and encourages experimentation that was previously too time-consuming.
3. CONCLUSION
I have always relied on tools—chalk, pencils, symbolic software, TikZ, and LATEX. ChatGPT now joins this toolkit. It does not replace mathematical thinking; it amplifies it by clearing away routine obstacles. The result is not only efficiency but freedom: I can try more ideas, draw more pictures, and explore more patterns.
In Part II of this article, I turn to another domain where ChatGPT has become indispensable to me: small-case computation and the construction of examples—activities central to mathematical discovery.
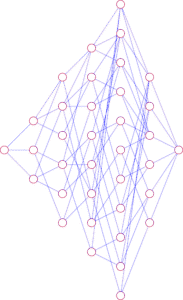
Figure 3. The lattice of all sublattices of N6, drawn sideways.


